41
data to be correct, but there is no need to reduce the complexity andmake sure the general
public understands. The designer has no control over the quantitative or qualitative data that is
being visualized; therefore, he or she has lesser control withwhat the final outcomewill look
like. The designer role is to design a template for the data to fall in. Data visualization can be
appreciated out of context based on the aesthetics alone.
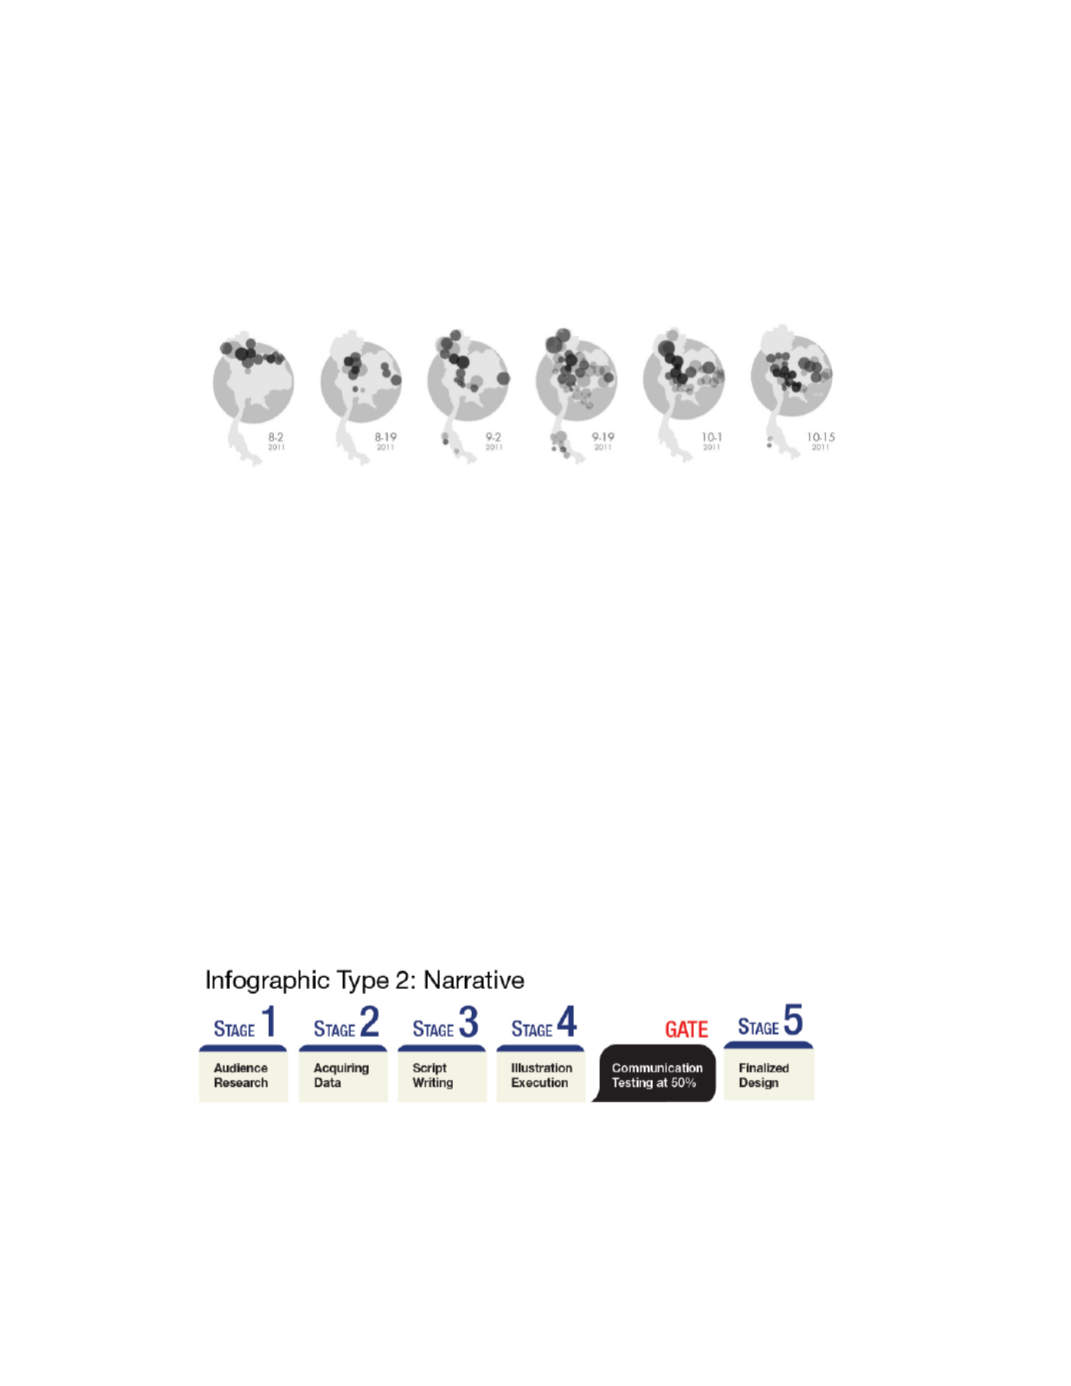
Figure 3.6: Thailand 2011 Flood Progression (Data Visualization Type)
The researcher designed data visualization type infographic using the process he has designed.
The data was acquired from the news website, which keeps track of flooding throughout several
region of Thailand. The data show the gradual flooding. But even for the audiencewho do not
understand the context, the transformation still provide certain aesthetic value, while people
who understand the context appreciate the design a lot more. The researcher had limited
control over how the designwill turn out. He only assigned colors to each element on the
map, with the darkness of the tone representing the depth of thewater in the flooded area in
Thailand. The full visual is then generated based on the data on the days.
Figure 3.7: Infographic Design Process Type 2: Narrative


