15
Figure 2.2:
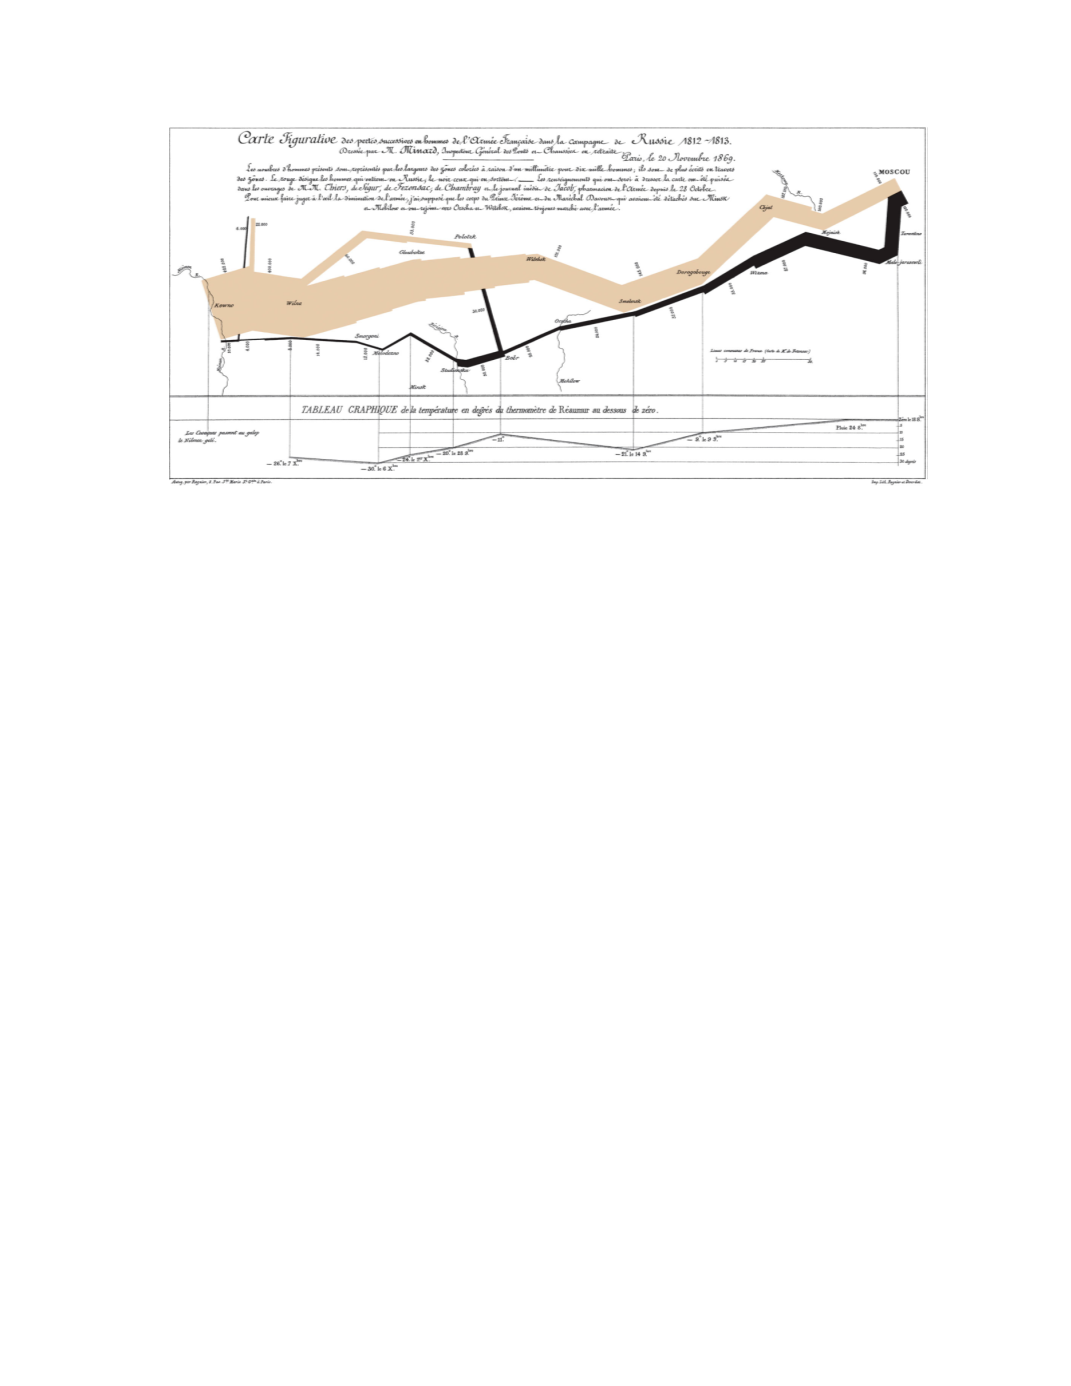
Carte Figurative…
by Charles JosephMinard (1869)
In another one of Edward Tufte’s book, The Visual Display of Quantitative Information (1869),
Edward Tufte analyzed the flow map, a map that does not aid navigation but instead
indicates the direction and movement of a certain subject, titled Carte figurative des pertes
successives en hommes de
l'Armée Française dans la campagne de Russie 1812-1813. This
ingenious flow map by Charles Joseph Minard depicted the timeline of Napoleon's 1812
invasion of Russia. In the timeline, the brown larger shaped line represented Napoleon’s
troop marching forward toward Russia and the black shaped line represented their retreat
back sometime later. The size of the army going forward is shown in light brown color, which
could have resembles the color of a human flesh. The strong contrast between the
advancing and the retreating makes the flow map very dramatic. Even more impactful, the
timeline also shows the temperature, which was a major factor contributing to the loss of
life; the relationship between the drop in temperature and the size of the army is very clear.
In his book, Edward Tufte claimed that Minard’s flowmap "may well be the best statistical
graphic ever drawn” (1983).
2.2.3.3 Isotype
Isotype is a type of infographic that utilizes symbols and icons to represent quantitative
information. The most noticeable difference in isotype from other types of infographic is its
usage of large number of pictograms along with charts. Modern graphic design works made
up of repeating symbols to display quantity are often labeled as or compared to isotype.
Otto Neurath, an Austrian philosopher of science, along with his wifeMarie Neurath, were the
creators andmajor forces behind isotype. Isotype was perceived as a possible new evolution


